

The Consensus Gap
91% of AI citations show up in only 1 engine


This Memo was sent to 26,564 subscribers. Welcome to +115 new readers! Upgrade to Premium for the full archive, research, frameworks, and templates
Most teams talk about “AI visibility” like it’s one thing. New data on 3.7 million citations across ChatGPT, Perplexity, and Google AI Overviews suggests it isn’t. And the gap between the 3 engines is wider (and more strategically important) than your dashboard likely admits.
Today’s memo breaks down:
Why a blended AEO score hides the only finding that matters
Which page types and domains actually travel across engines
The shift from measuring AI presence to measuring portability
Premium subscribers also get the YouTube exception data, the universal-winners domain list, and 3-step operator guidance for separating engine-level visibility from market-level claims.

I get pitched a lot of AI search tools. Most tell you where you rank. Almost none tell you what to do about it.
AirOps just launched the first serious answer to that gap I’ve come across, and I think it resets the category.
Not a dashboard. Not a writing assistant. A growth platform built for marketers operating in AI search: see where you’re cited, ship the work that closes the gaps, and measure what actually moves.

On May 21, the team is going live with a walkthrough of what they shipped and how to use it.
Live demo with the team building it:
Amr Shafik (VP Product)
Eoin Clancy (VP Growth)
Melanie Dell’Olio (Manager, AI Solutions).
May 21, 3pm ET. Live on Zoom.
Recording goes out after. Live room gets the unfiltered version.

One of the biggest differences between AEO and SEO is that AEO plays on more platforms.
Omnia data shows across multiple samples that only 2.35% to 2.45% of cited URLs appeared in ChatGPT, Perplexity, and Google AI Overviews for the same prompt. 91% of citations appeared in only one engine.
Conclusion: AI visibility is not a single leaderboard. Instead, it’s 3 different distribution systems that sometimes overlap and usually do not.
Only 2% of URLs get cited by all 3 engines
Most people would guess that if a URL gets cited by one major AI engine, it has a reasonable shot at appearing in the others.
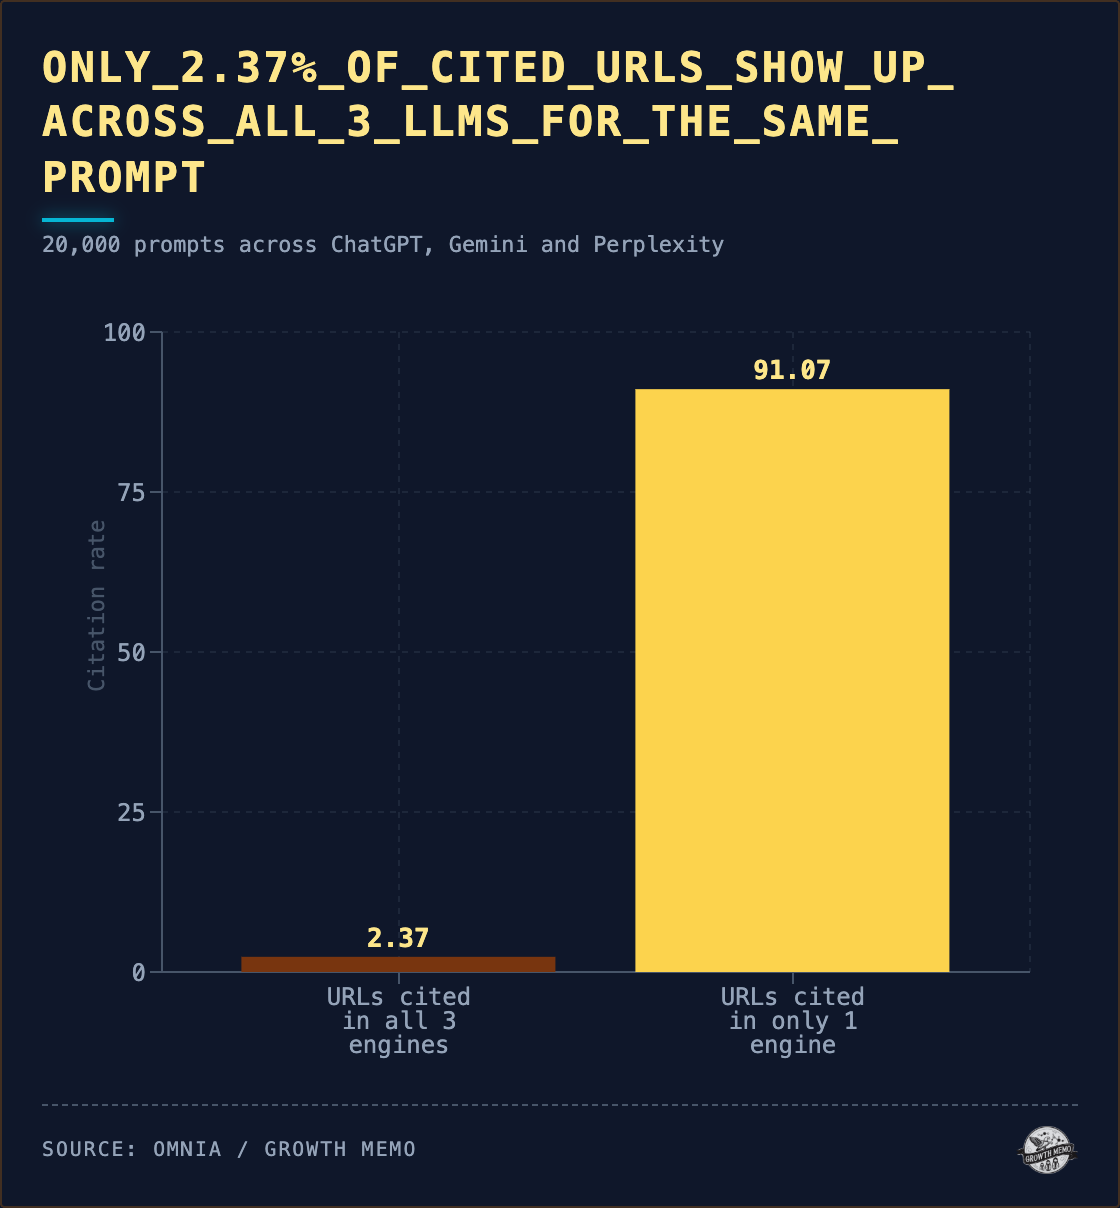
But the 20,000 prompt sample shows only 2.37% of cited URLs show up across all 3 engines for the same prompt.
Meanwhile, 91.07% show up in only one. Those 2 numbers belong next to each other because they explain each other. The remaining ~7% overlap in pairs, which means engines are drawing from largely disjoint pools rather than ranking the same pool differently.
For AEO / SEO teams, that means a single composite visibility score is the wrong unit of measurement. Averaged AEO scores hide this. A brand can look strong in aggregate and be invisible in 2 of 3 engines. Teams chasing one blended AI visibility number are compressing 3 ranking systems into one metric and calling it strategy.
The 2% holds across every cut
The ~2% overlap rate and ~91% exclusive rate stays almost perfectly flat across 4 samples.
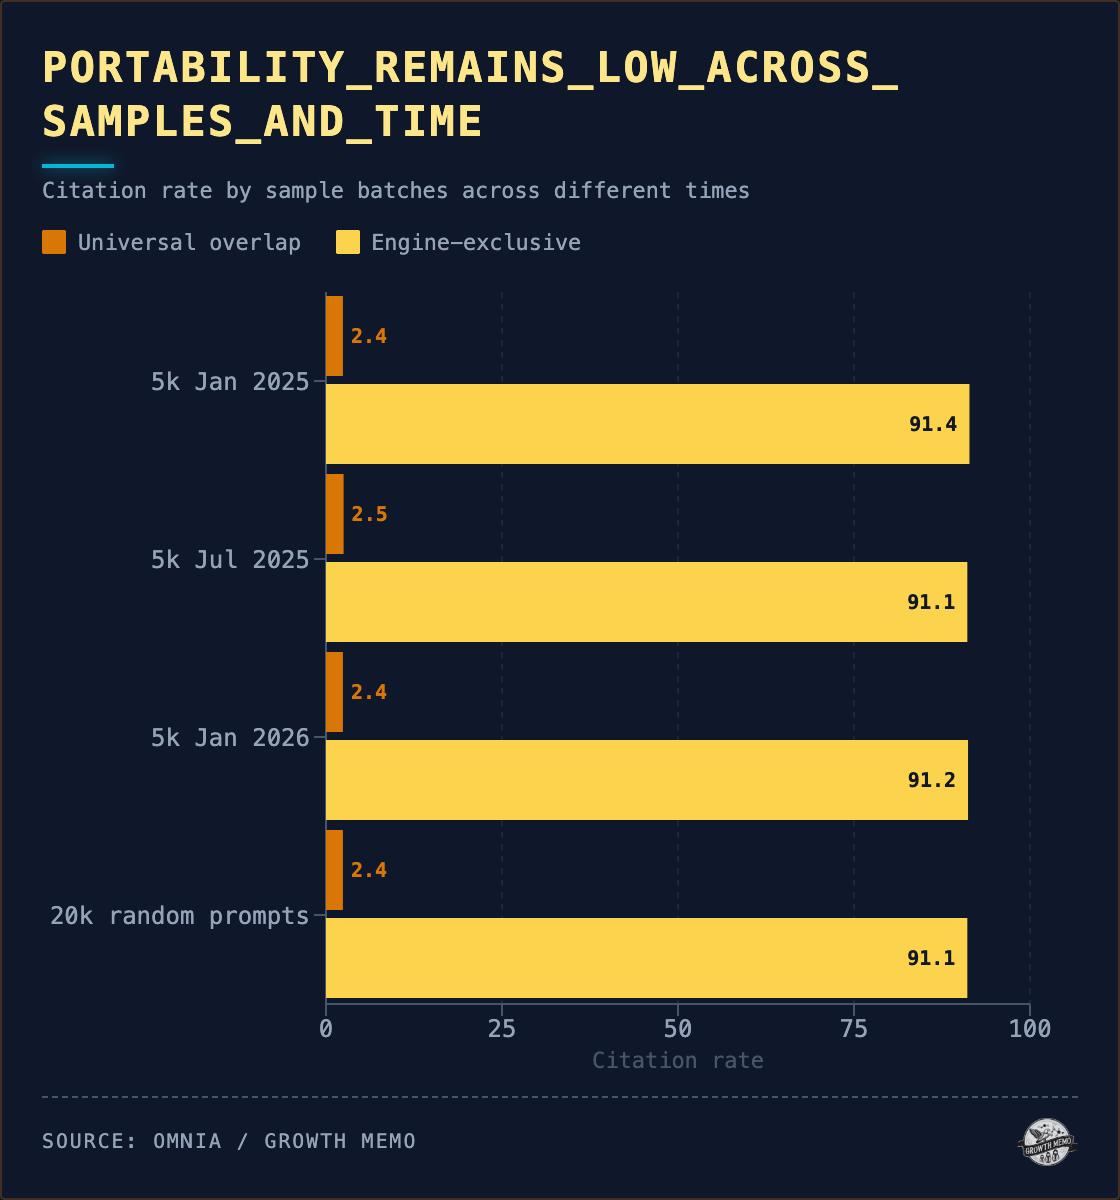
That consistency matters more than the exact decimal point. The consensus gap is not an artifact of one query set or one time window. It looks structural.
In Q3 2025, universal overlap was 2.2%. In Q4 2025 and Q1 2026, it rose to 2.7%. Engine-exclusive citations fell from 90.1% to about 88%. So yes, a small amount of convergence. But even after that shift, fragmentation still dominates.
Commercial prompts don’t converge either
The intent split is one of the quietest but most useful parts of the dataset. You could argue that commercial queries should produce more consensus. When someone searches for the best CRM, best running shoes, or best project management software, the pool of acceptable sources feels narrower than it does for broad informational prompts.
Surprisingly, the data does not support a big difference.
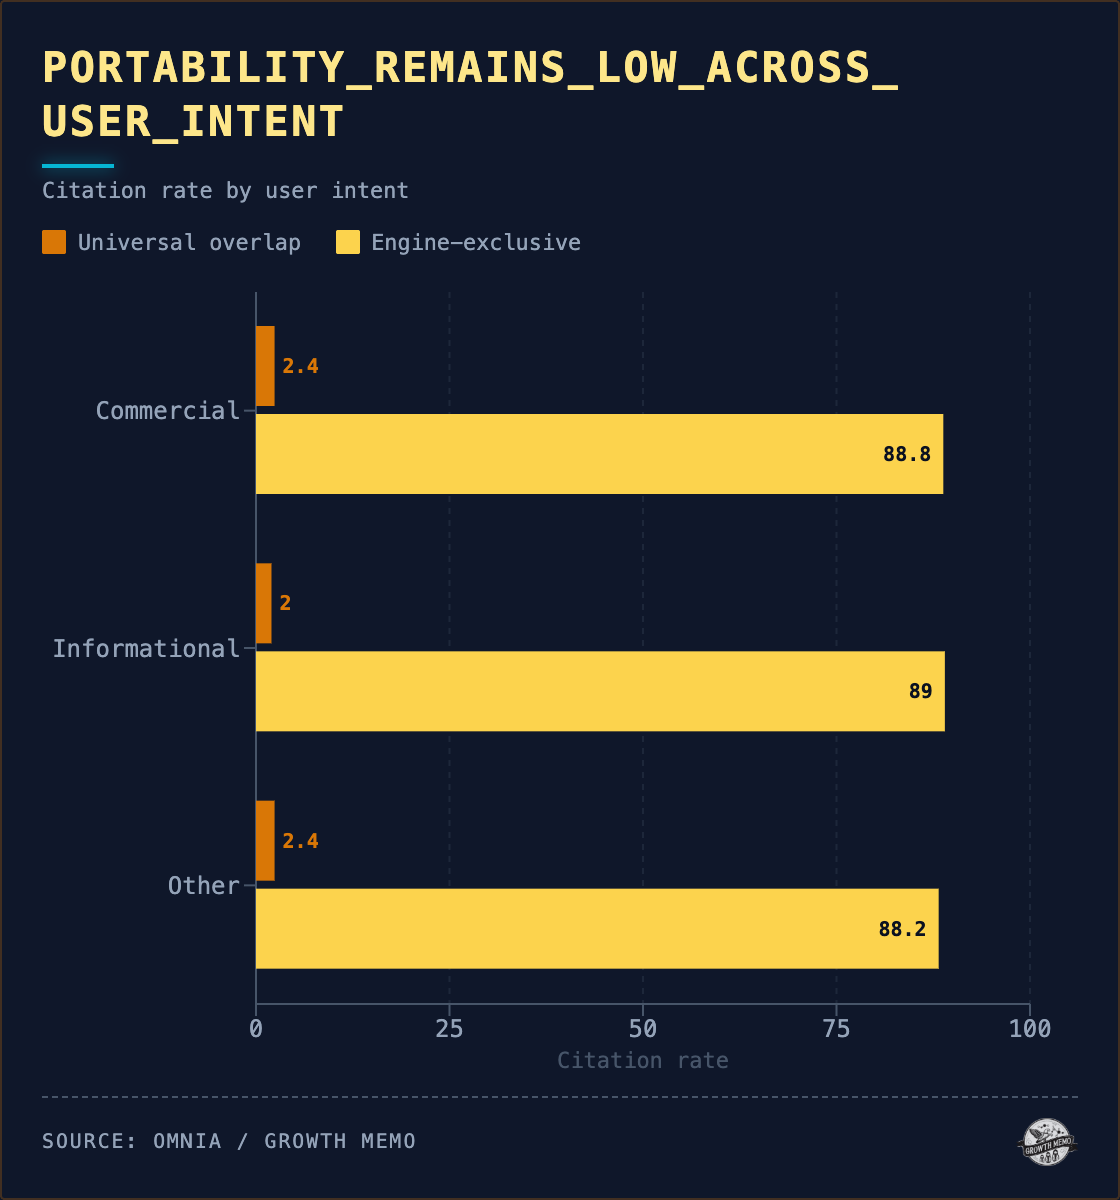
Commercial prompts show 2.4% universal overlap. Informational prompts show 2.0%. Even when the query should narrow the answer set, the engines still choose different sources most of the time.
That pushes against a common instinct in SEO and content strategy. Teams often assume high-intent queries are where shared authority will show up. The opposite looks closer to true. Even in commercial territory, each engine’s own retrieval logic, what sources it trusts, what formats it prefers, is doing most of the work.
Guides beat homepages by 2x
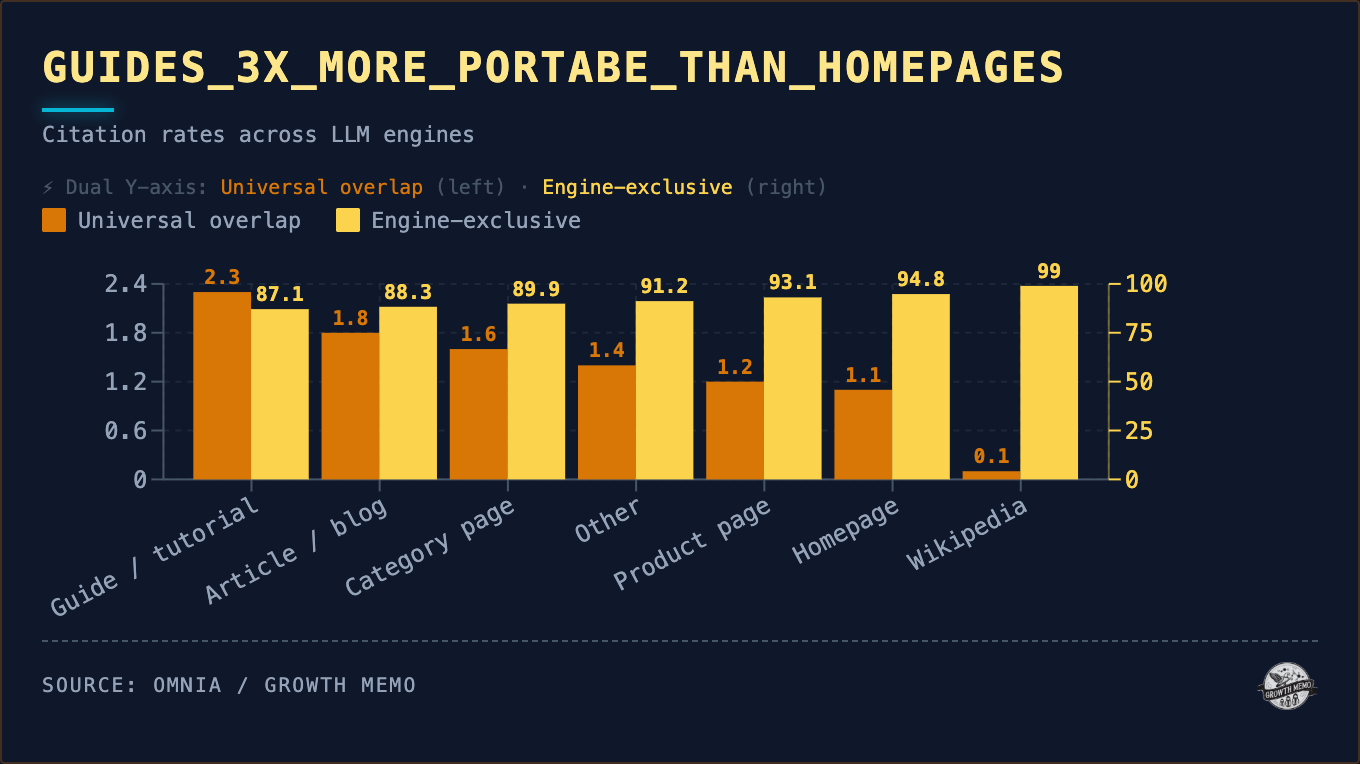
The page type breakdown below shows guides and tutorials have the highest cross-engine overlap at 2.3%, followed by blogs at 1.8%, category pages at 1.6%, product pages at 1.2%, and homepages at 1.1%.
Two lessons:
First, explanatory content travels better than brand or transactional assets. If you want the best shot at showing up across engines, the strongest candidate is not the homepage and not the product page. It is the page that helps, explains, compares, or teaches, but keep in mind that these are also content formats that AIs can answer directly well.
Second, even the best page types perform badly in absolute terms. Guides are not winning across engines in any meaningful sense. The right read on this is not “publish more guides and you will win everywhere.” It’s simpler than that: Helpful content travels better than brand content.
Visibility is not the same as portability
One of the easiest mistakes in this space is to confuse citation frequency with citation portability. Wikipedia is the cleanest example. It appears 16,073 times in the dataset, but only 1.3% of those appearances are universal across engines. Reddit appears 14,267 times, but only 0.1% are universal. Reuters shows up 1,202 times and still lands at 0.0% universal overlap.
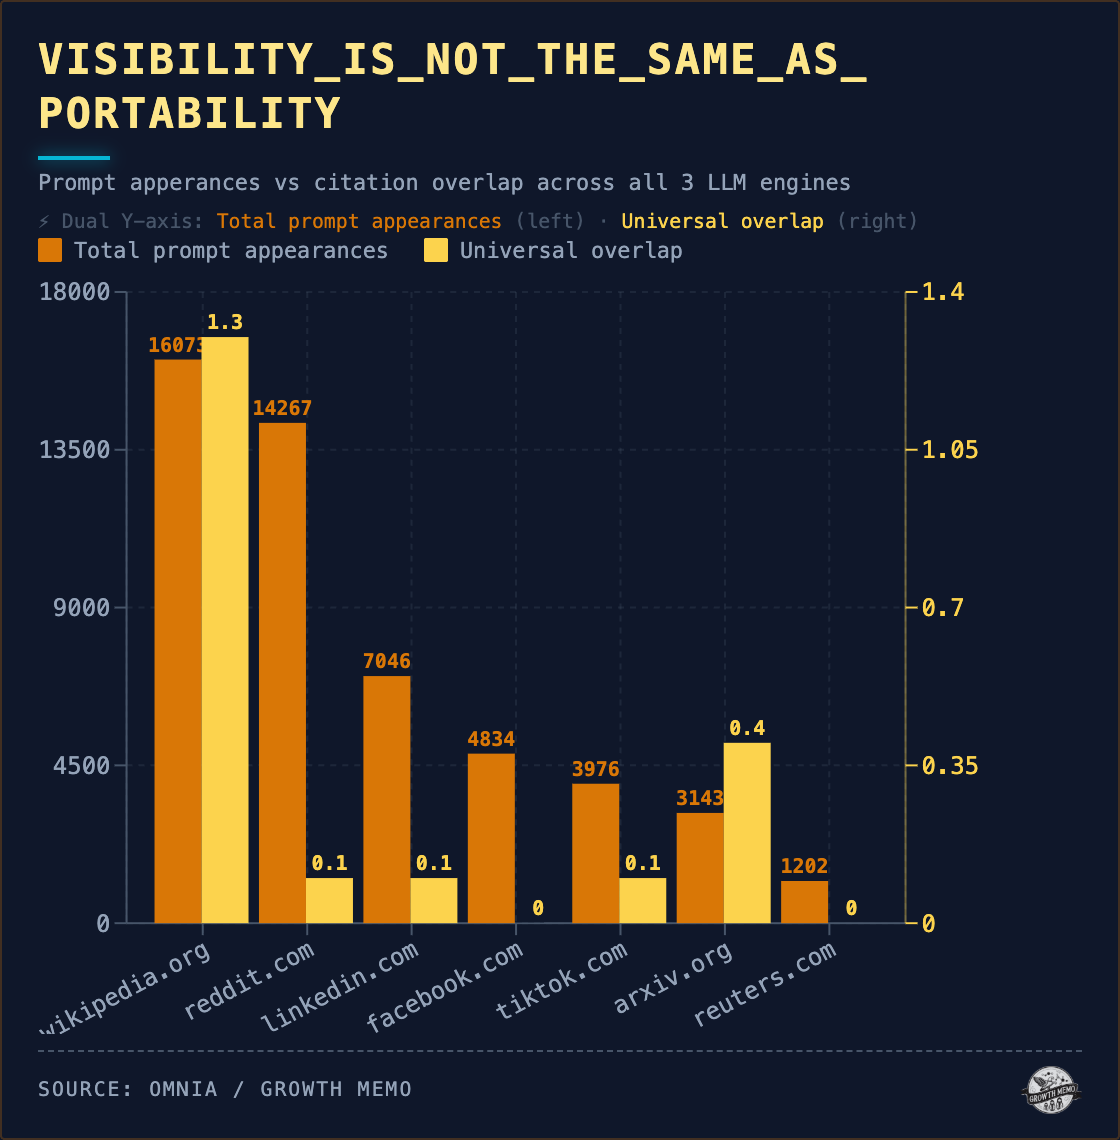
That is why an important metric is portability. A domain can show up all over one engine and barely travel, which means a brand looking dominant in an aggregate dashboard may be one platform’s habit away from invisibility. Presence tells you whether you are visible. Portability tells you whether that visibility is resilient.
What this means for operators
The practical implication is simple: Stop treating AI visibility as one thing. Examine the comprehensive visibility of your domain by measuring:
1/ Presence, the % of your tracked prompts where your domain appears in any engine. Presence tells you whether you’re visible.
2/ Portability, the % of your cited URLs that appear in all 3 engines. Portability tells you whether that visibility is resilient.
3/ Concentration, the % of your citations that come from a single engine. Concentration tells you which engine your current dashboard is secretly built on.
If overlap between engines is this low, a single AEO strategy is too abstract to be useful.
When we approach AI visibility from a holistic perspective, it forces sharper questions:
Which engine matters most for us?
Which of our assets travel across engines, and which only work in one?
Are we measuring presence when we should be measuring portability?
This also changes how brand teams should think about diagnostics. A weak homepage across engines may not be a homepage problem. It is a symptom of something broader: Engines favor utility over brand centrality. In that world, visibility comes less from being the official source and more from being the useful source.
The strategic question is no longer How do we rank in AI? We should instead be asking ourselves How do we build assets that survive different engine preferences? That is a narrower question. It is also a better one.
Methodology
There are a few caveats to this analysis:
The dataset is skewed toward Omnia’s customer base.
The intent and page-type cuts rely on regex classification, which is useful for directional analysis but not perfect taxonomy work.
Those caveats do not weaken the main finding much. The biggest signal is not precision at the edges. It is consistency at the center. No matter how the cuts change, the same pattern resurfaces: very little overlap, very high engine-specificity, and only modest differences by time, intent, or page type.
Dataset size and time window
The analysis draws on 4 prompt samples. Three cohorts of 5,000 prompts each, tracked from 1 January 2025, 1 July 2025, and 1 January 2026. A separate 20,000-prompt random sample underpins the headline 2.37% and 91.07% figures. The time-view cut spans Q3 2025 through Q1 2026 (to date) and covers 3.7 million URL citations in total. Commercial / Informational / Other intent splits are drawn from roughly 2.6 million URLs across the combined sample. Page-type splits span 4.1 million URL appearances.
How prompts were selected
The 20,000 prompts are drawn as a random sample from Omnia’s live prompt monitoring pool. The pool reflects what real marketing teams chose to track, weighted toward Omnia’s customer geography (Spain-heavy, plus UK, Nordics, and other EU markets). Each prompt runs in its country’s primary language, so Spanish is overrepresented versus a US-only dataset. Industry mix is fintech/insurtech, travel, SaaS, B2B services. Treat findings as directional for European AI search.
Engine coverage
The study covers 3 engines: ChatGPT, Perplexity, and Google AI Overviews. Each fires the same prompt concurrently within the same minute, twice a day, with country localization and each engine queried in its default web-enabled, unauthenticated state. Perplexity tracking runs on sonar, while ChatGPT and Google AI Overviews use each vendor’s default production model for logged-out web browsing (which neither OpenAI nor Google pins publicly to a specific version).
Classification methodology
Intent and page type are assigned by regex. Intent buckets are Commercial, Informational, and Other. Page-type buckets are Guide / tutorial, Article / blog, Category page, Product page, Homepage, Wikipedia, and Other. The rules are keyword- and URL-pattern-based, which makes them fast enough for a multi-million-URL dataset but coarse at the edges. Edge cases fall into Other, which is why Other carries a high share in both the intent and page-type tables. Treat the regex cuts as directional, not authoritative.
Premium: The YouTube exception and the few universal domain winners
Domain-level data sharpens the page-type finding. Most social and UGC platforms are invisible across engines. As mentioned above, Reddit is at 0.1% universal overlap. But the UGC platform pattern holds: LinkedIn is at 0.1%. TikTok is at 0.1%. Facebook is at 0.0%. Quora is at 0.0%.
Then there is YouTube. And a small set of outliers that illustrate even some “portable” winners are only partially so.
