


Wouldn’t it be such a relief if we found out there’s actually a meaningful amount of AI traffic that’s just hidden in our analytics tools? I sense a strong belief in the industry that a lot of AI traffic hides as, or arrives as, Direct in our analytics tools. I get where this comes from because I wrote about it:
In our AI Mode user behavior study, 18% of exits involved users leaving AI Mode and going directly to another site.
In Is AI cutting into your SEO conversions?, I described a potential journey from AI answers to brand recall to a direct visit, bypassing clicks.
In How to plan 2027 when traffic is down and AI won’t attribute, I cited Similarweb research showing that users who received AI brand recommendations were more likely to visit those brands’ websites over the following seven days. Most of those visits came through Search (55.9% vs. 40.4% for other visits), and fewer through Direct (19.9% vs. 38.8%).
If you need to explain how AI is changing search behavior to your team, the Premium Resource Library includes an AI Mode User Behavior Deck.
There’s a plausible mechanism here, but is the signal strong enough to trace Direct traffic from AI in our analytics? Somewhat. And now, we have an example.
In an interview on the Siege Media Podcast, Growth expert Eric Wu discussed how Ramp identified 30–40% of its direct traffic as originating from answer engines. I caught up with him and learned his team examined growth in Direct visits to long blog URLs that users were unlikely to type, filtered out patterns resembling email campaigns, and compared the remaining visits with organic search traffic. Some of that Direct traffic closely matched search visitors in time on page, scroll depth, and click behavior. Self-reported attribution confirmed that the users indeed came from AI.
That got me curious about whether the time is ripe to detect signal in our analytics. So, I went hunting for proof of hidden AI traffic.
Bots. Why did it have to be bots?
I analyzed the Google Analytics 4 properties of 12 sites, using the same August–September 2026 comparison and excluding homepages, localized homepage roots, and unknown landings. Keep in mind that this small sample of 12 sites skews toward B2B, even though traffic is almost evenly split between B2B and B2C. All sites except 2 target the US.
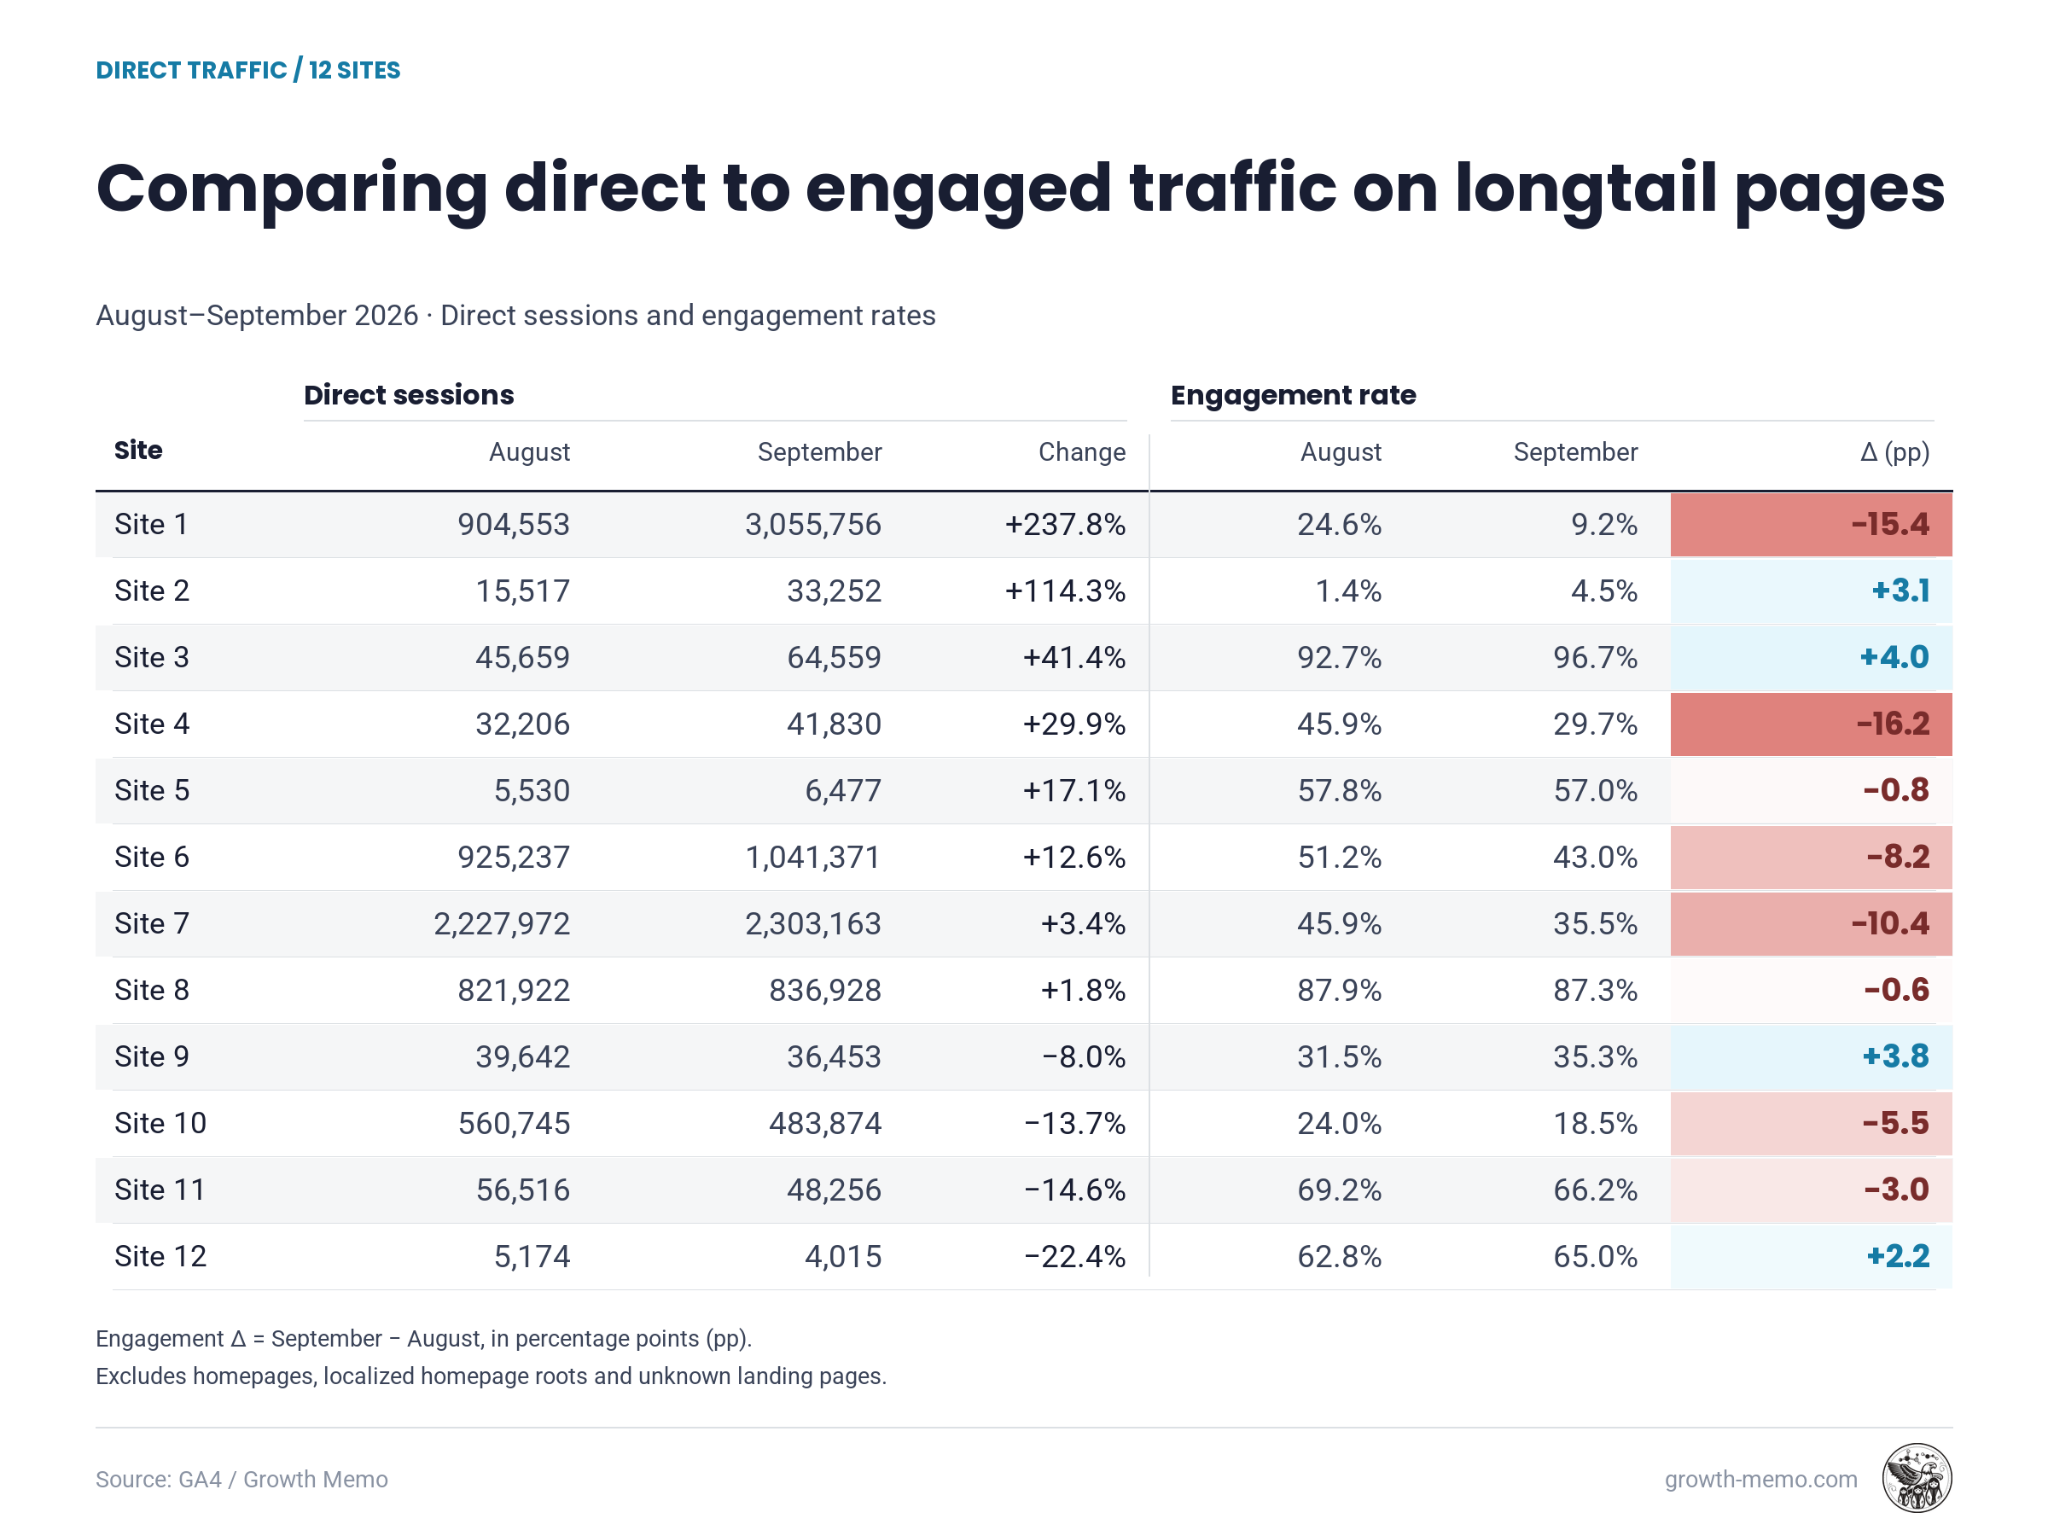
At first, I got really excited: 8 out of 12 properties showed direct traffic growth from August to September! Some even over 100%. But when I dug deeper, much of that direct traffic turned out to be automated bot traffic. At one website, GA4 recorded 409,000 Direct sessions, of which only 198 counted as engaged.
Comparing the increase in all Direct sessions with engaged sessions alone shows a clear picture: engaged Direct traffic has been flat since the beginning of the year. Across the filtered January–September sample, total Direct rose 140.9%, while engaged Direct changed −1.0% in monthly counts, or +2.3% in average daily volume (when normalizing for days per month).
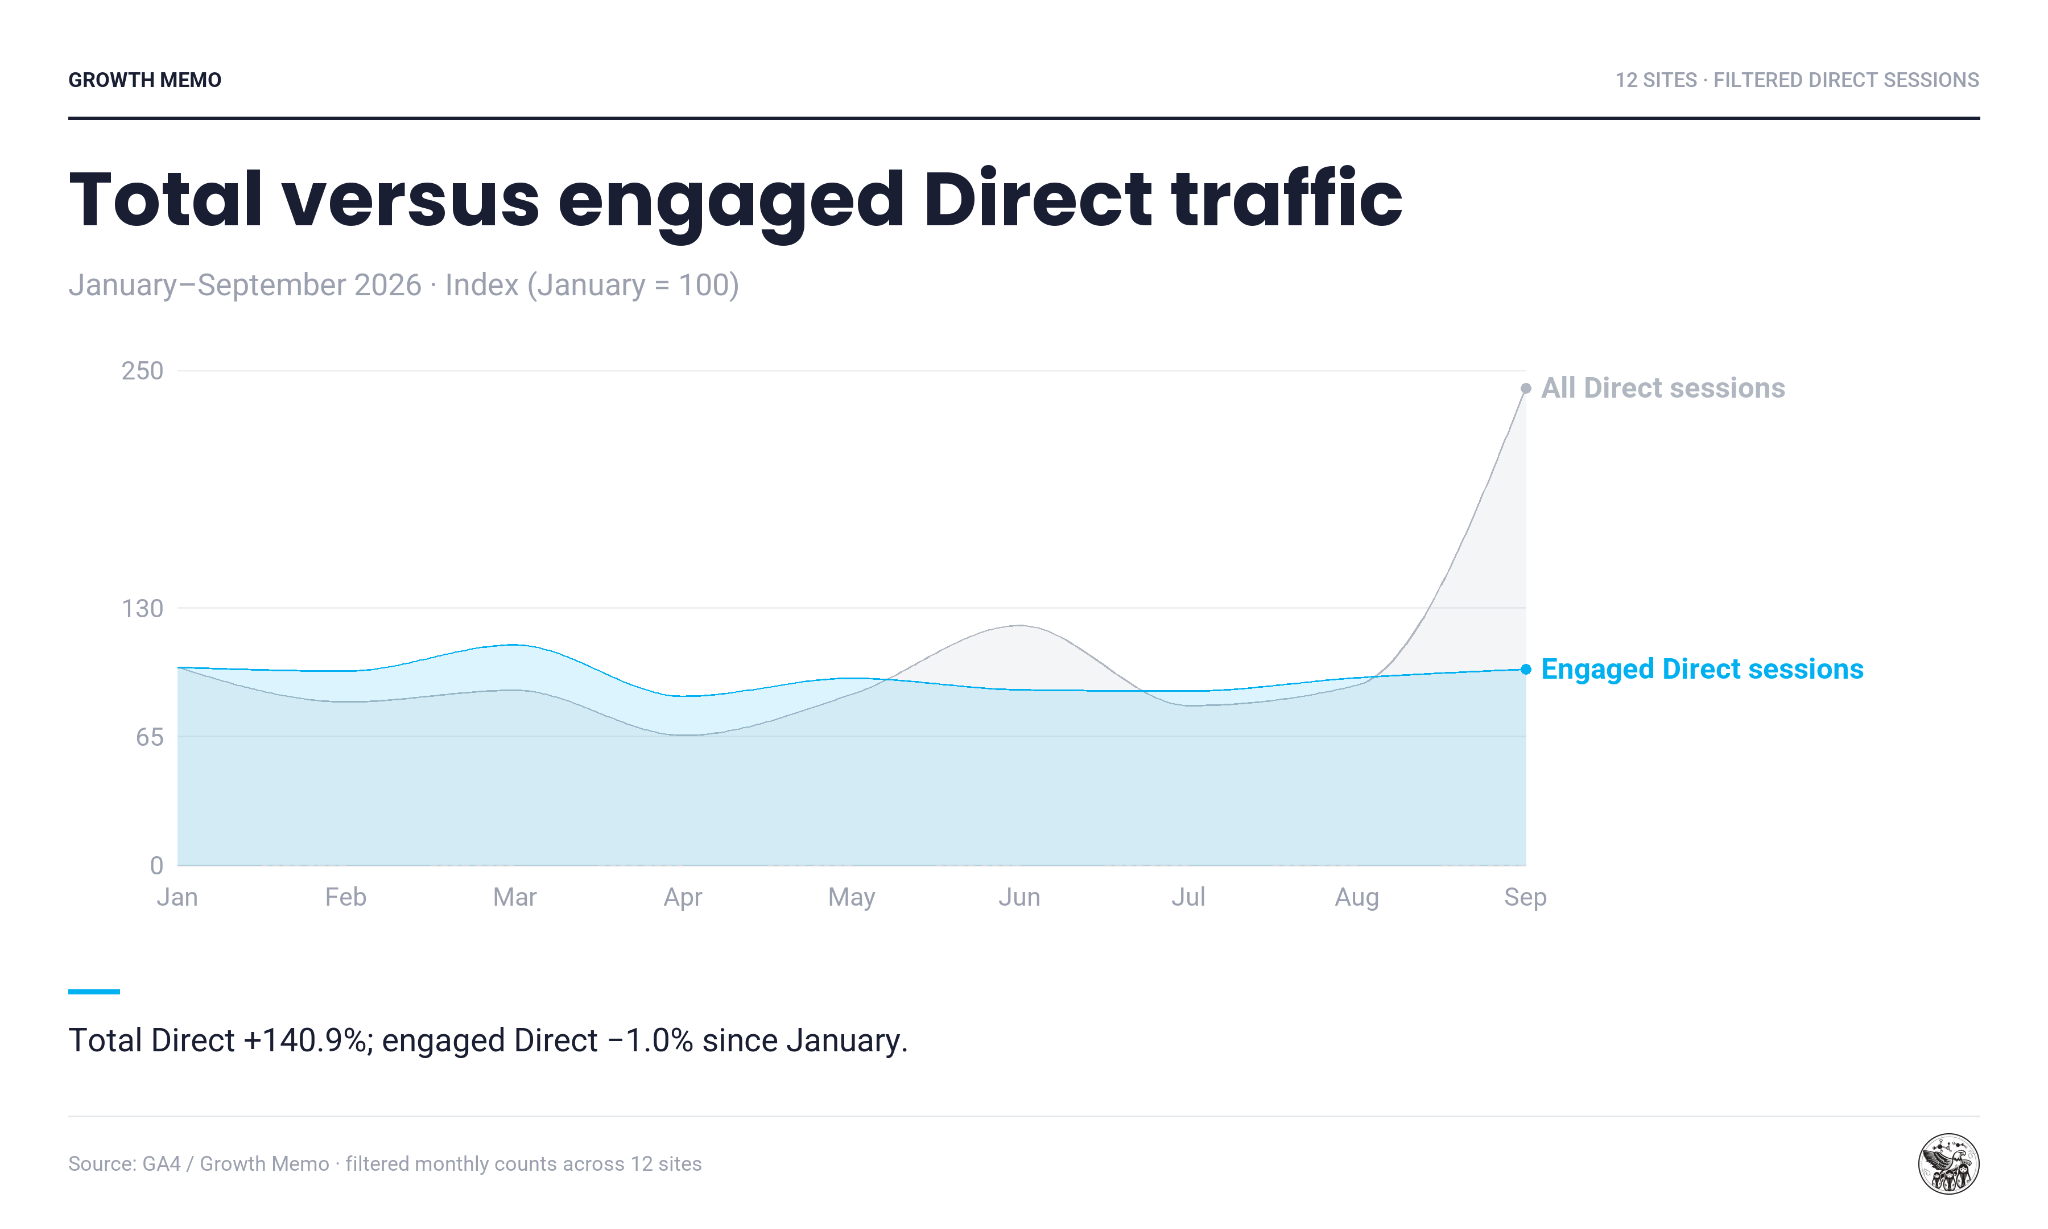
Conclusion: I could not yet detect “hidden” AI traffic without self-reported attribution like Eric and his team at Ramp. I also found that, on average across the 12 sites, Direct sessions with identifiable AI traces are only 0.003% of total direct traffic.
To uncover bot traffic, break Direct traffic down by day, landing page, country, browser, operating system, browser version, and screen size, and look for sudden growth concentrated in groups of visits with the same browser configuration and low or no engagement.
To find AI traffic, I excluded pages that typically get a high degree of direct visits, like pricing or login pages:
Main homepages, regional root domains, index aliases, and untracked landing URLs.
Subscription plans and pricing pages, including localized variations and donor-fee breakdown pages.
Authentication portals, user registration, account management, dashboards, webmail, and internal app paths.
Product demo requests, help docs, corporate about/team pages, investor relations, privacy policies, and internal search results.
Transactional flows, payment processing, purchase confirmations, billing receipts, and automated system alerts.
I’ve got a bad feeling about this
I didn’t want to give up here. So, I ran a separate analysis of four brands to test whether greater AI visibility was followed by more branded search or Direct traffic. Across 632 tests, I compared weekly AI visibility with both measures at delays ranging from the same week to six weeks later.
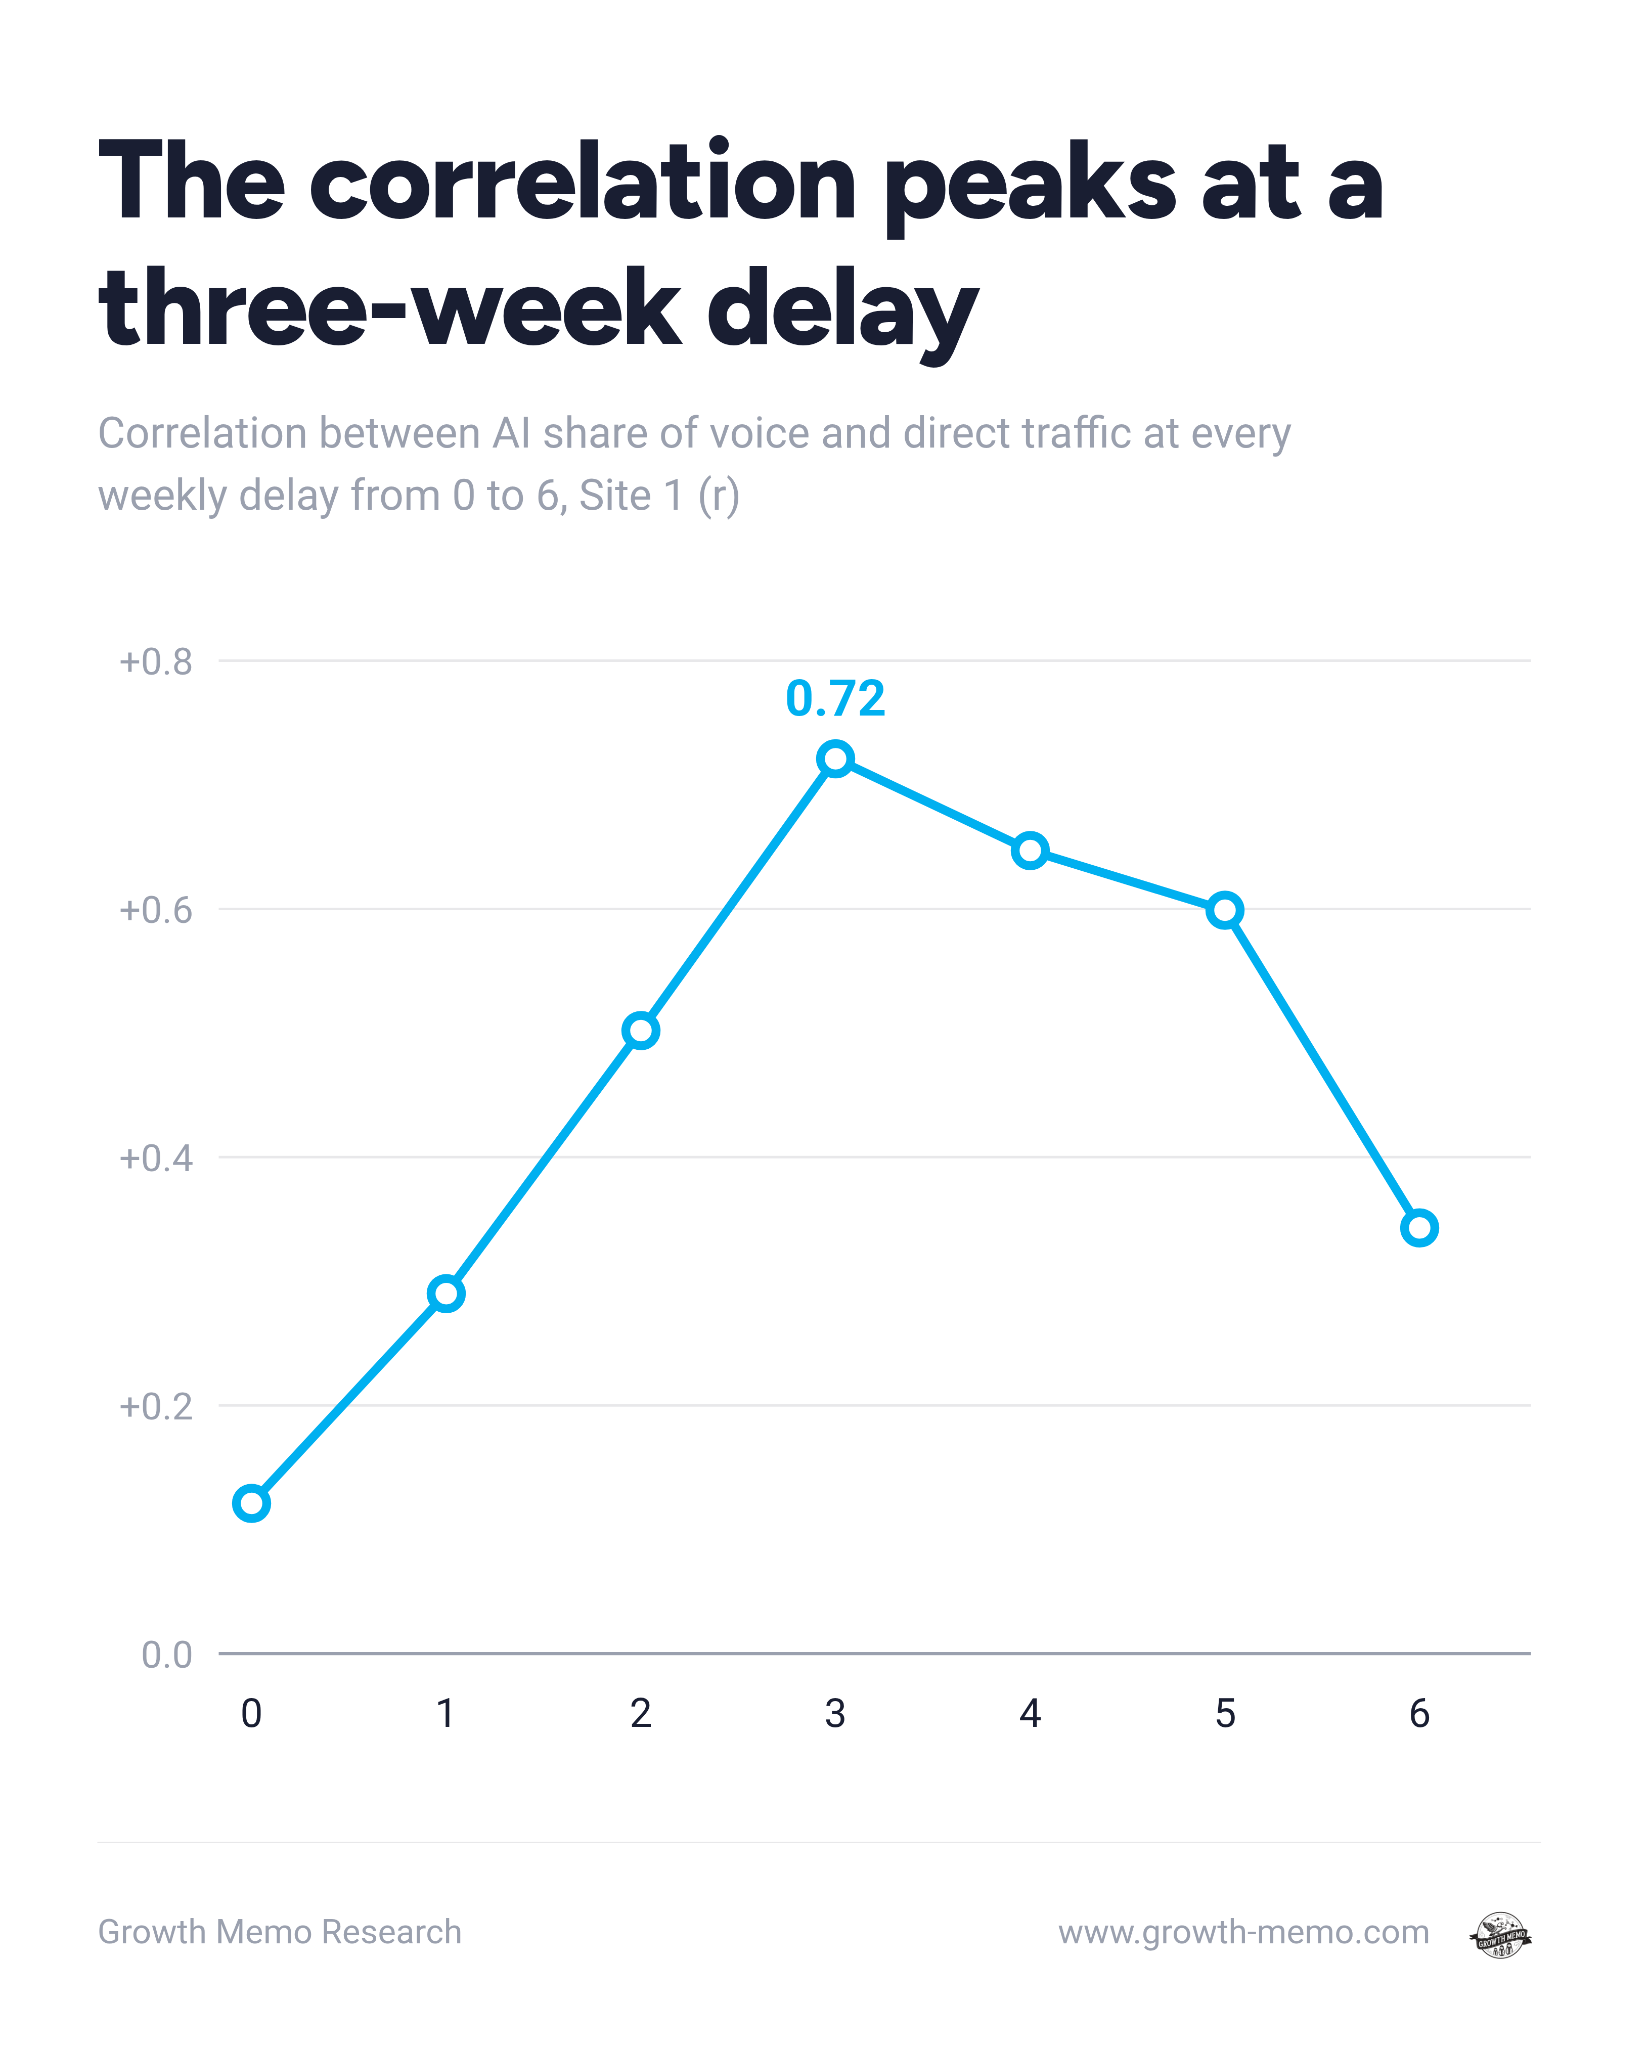
The first results looked promising! One site showed a correlation of 0.72 between AI Share of Voice and Direct traffic, peaking at a three-week delay. Its correlation with branded search impressions reached 0.59. A second site showed a 0.47 correlation between ChatGPT mention rate and Direct traffic. Let’s go!
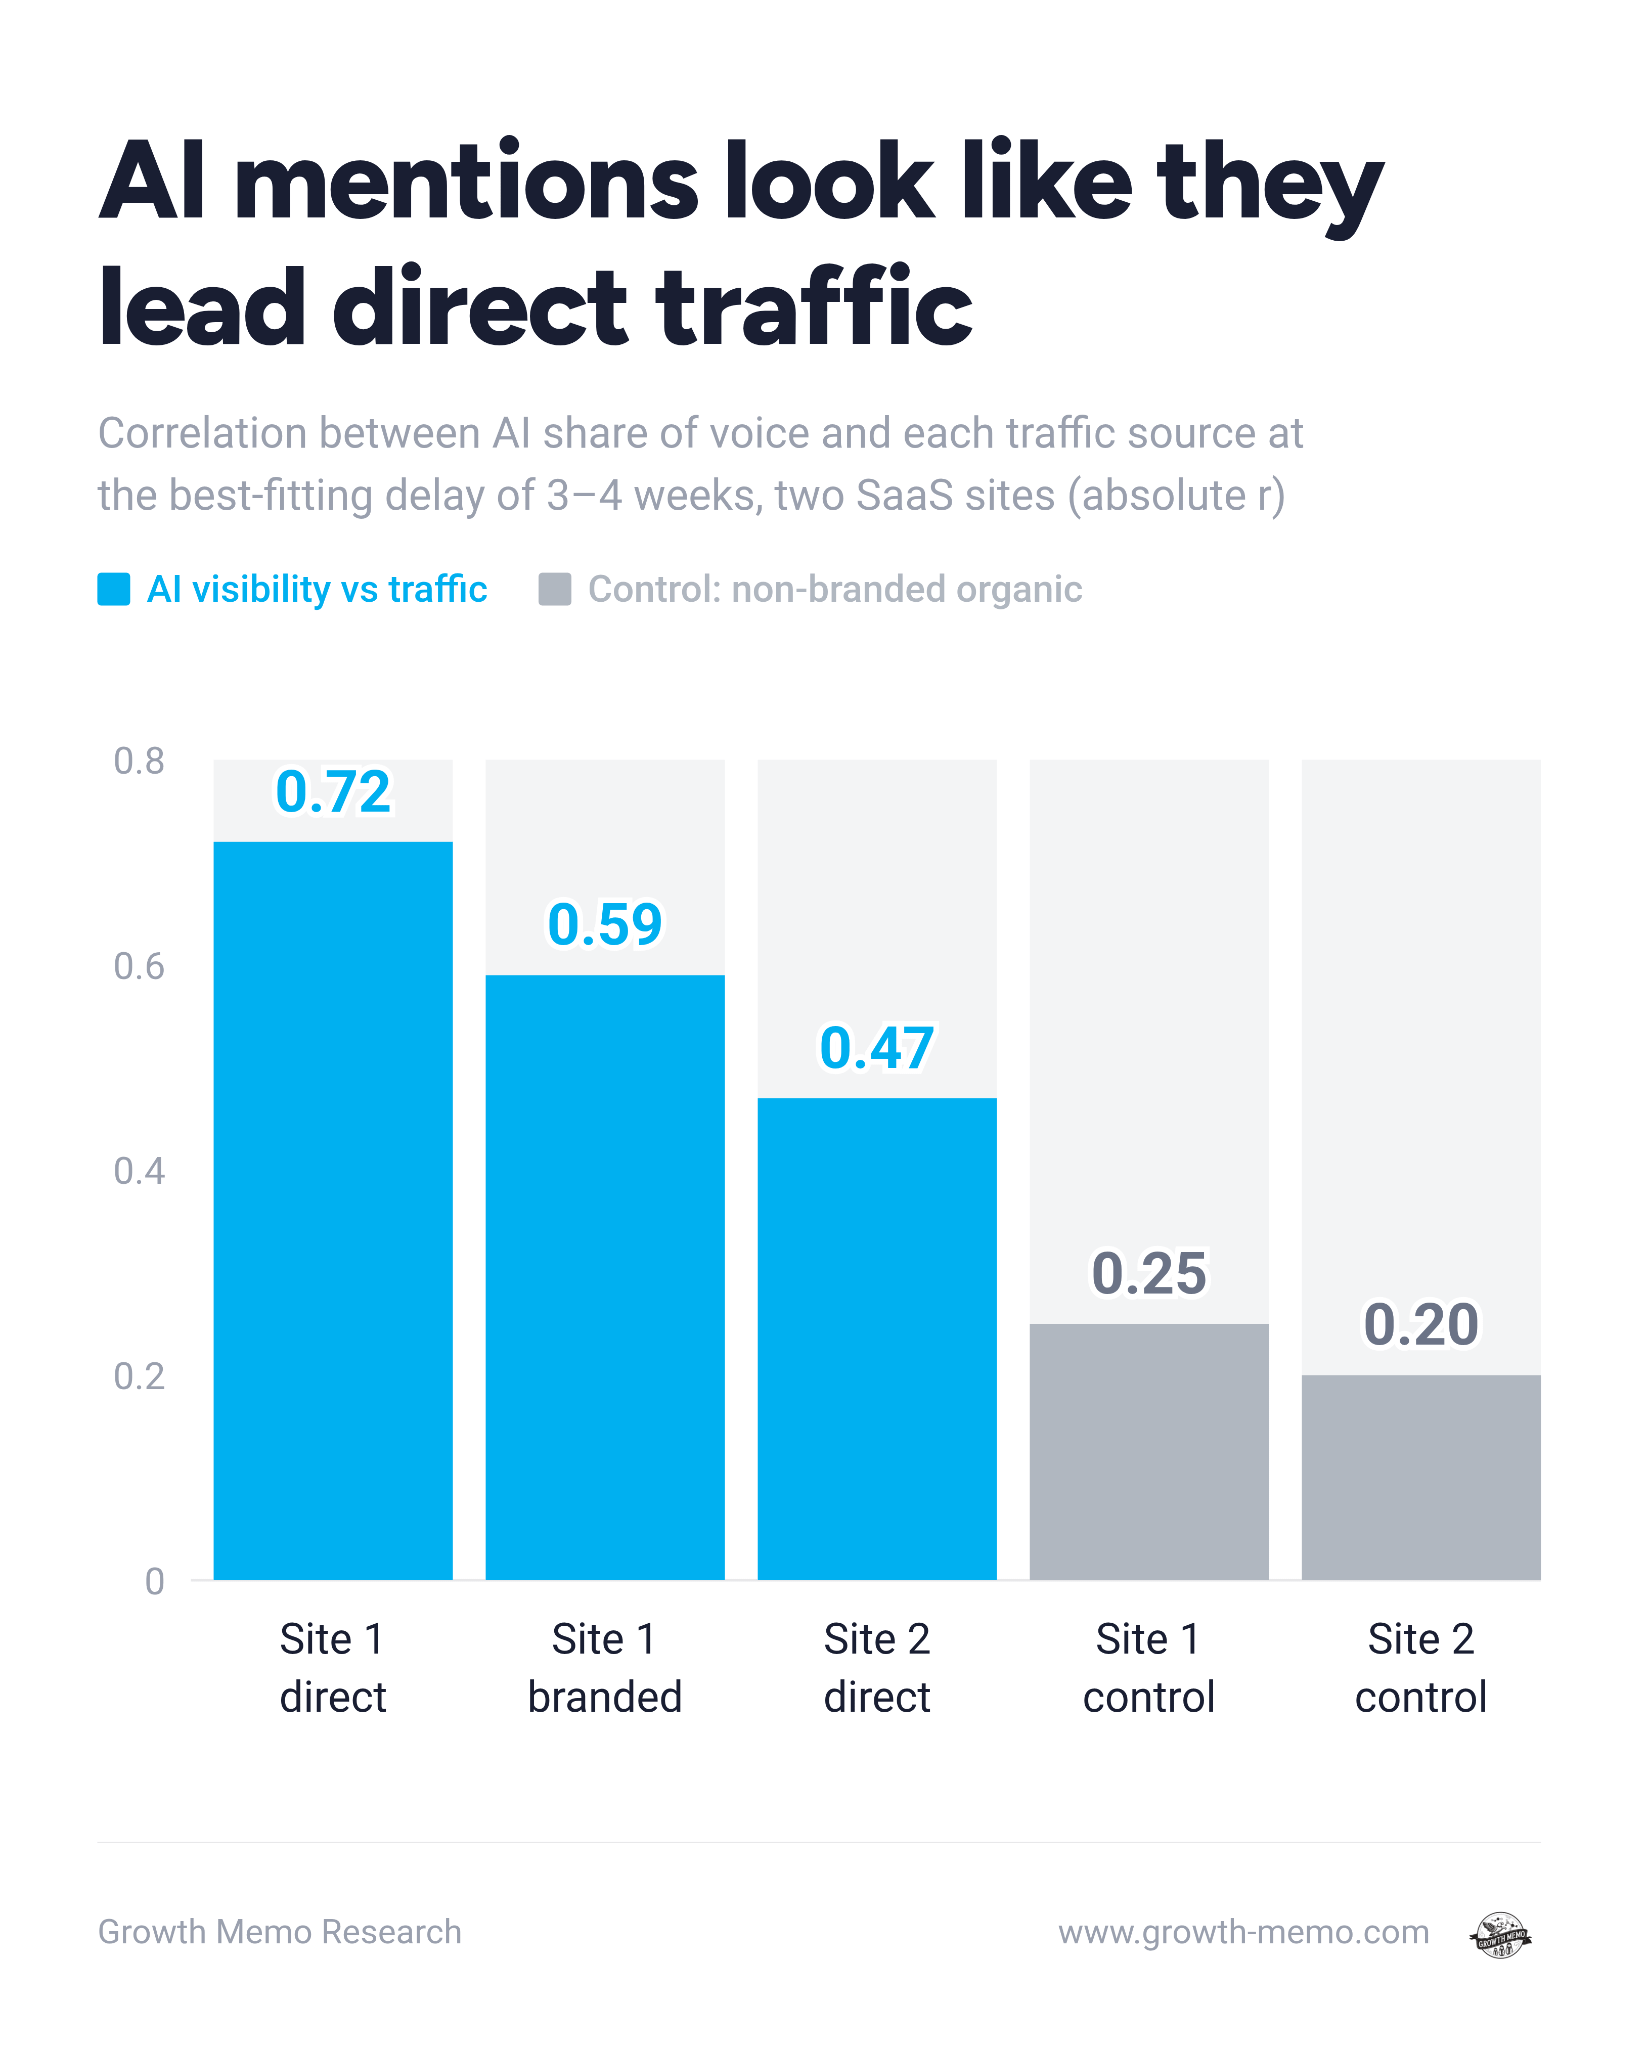
For the first site, the correlation peaked three weeks later, which made a delayed response look plausible.
Buuuuut a strong correlation needs a meaningful comparison. Two lines can move together because they share a trend, even without one driving the other. Correlation isn’t Cau… You know.
To check, I shifted the AI series against the traffic series, deliberately pairing different weeks while preserving the sequence within each series. If the actual timing carried useful information, it should outperform these mismatched versions. My initial comparison gave the real data an advantage. I had tested seven delays and kept the strongest correlation, but tested each mismatched version only at that winning delay. So I repeated the test. With every mismatched version getting the same seven chances and keeping its strongest result.
For the two Direct traffic examples:
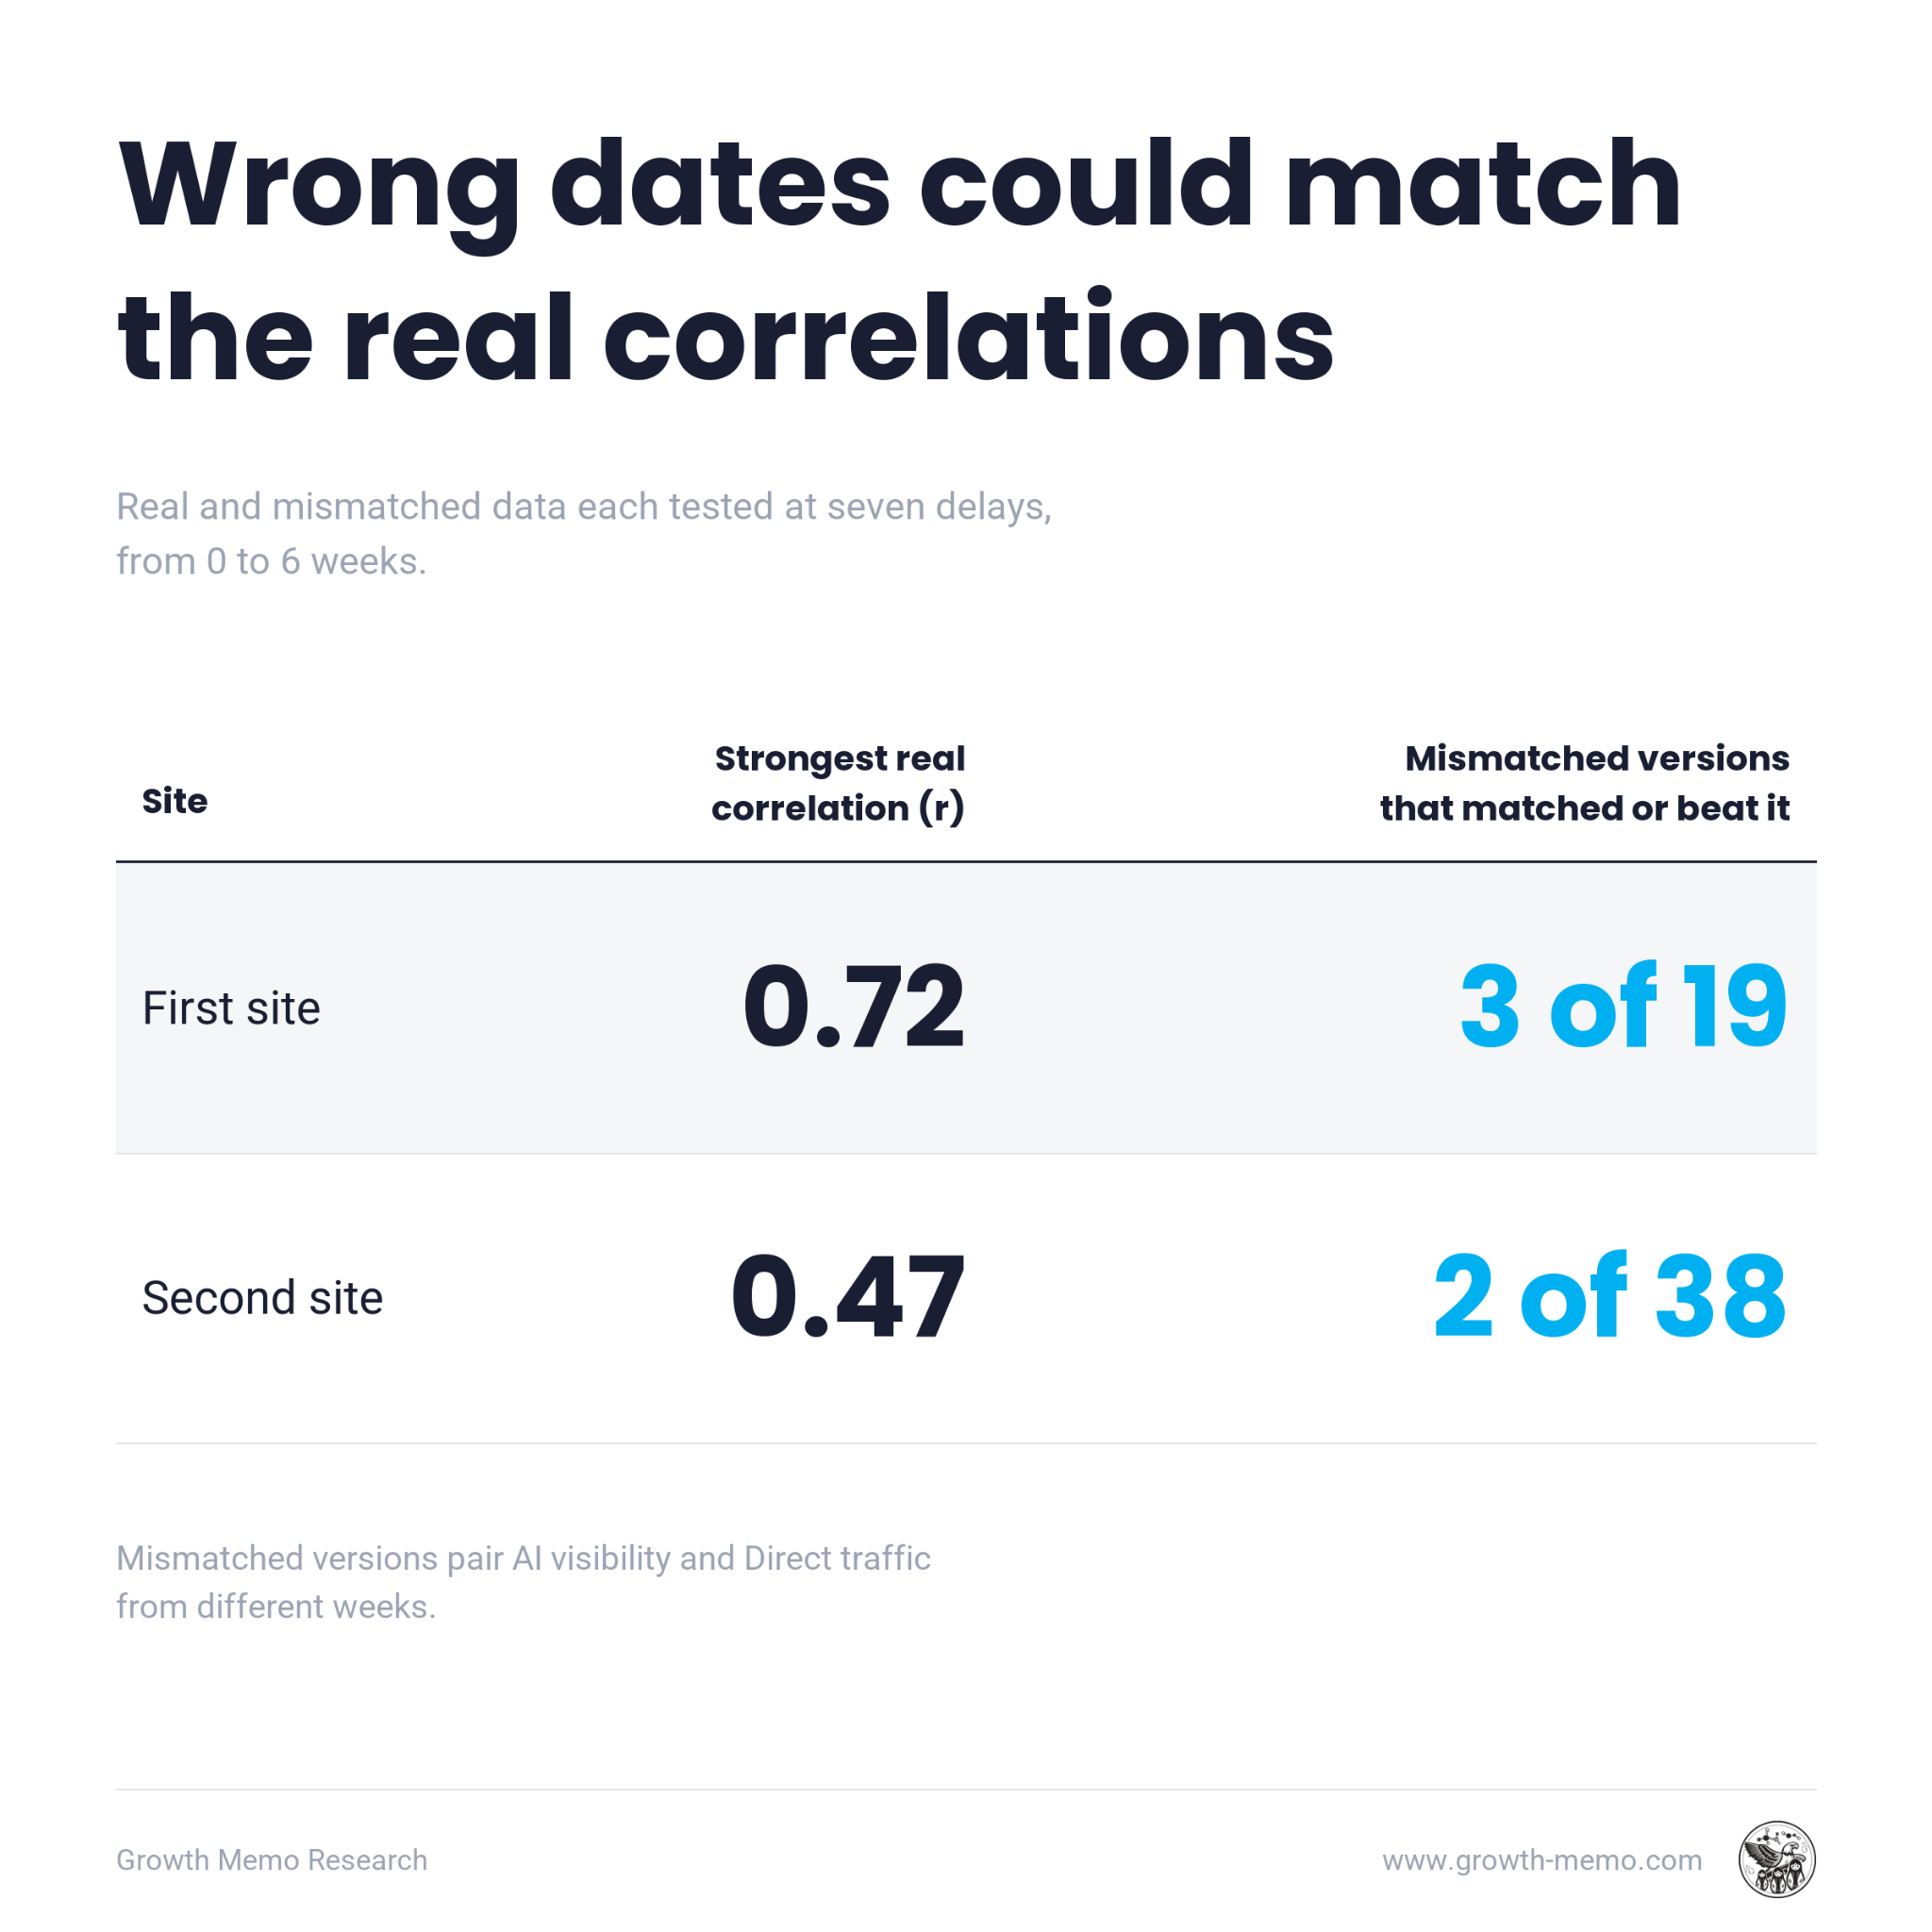
The correct dates beat most alternatives. But several wrong alignments produced equally strong or stronger correlations once they got the same opportunity to search. The relationships also depended on the period. When I split each timeline in half, the first site’s relationship was concentrated in the second half. The second site’s was concentrated in the first. Neither showed a consistent relationship across both periods, although the shorter windows made those estimates less precise.
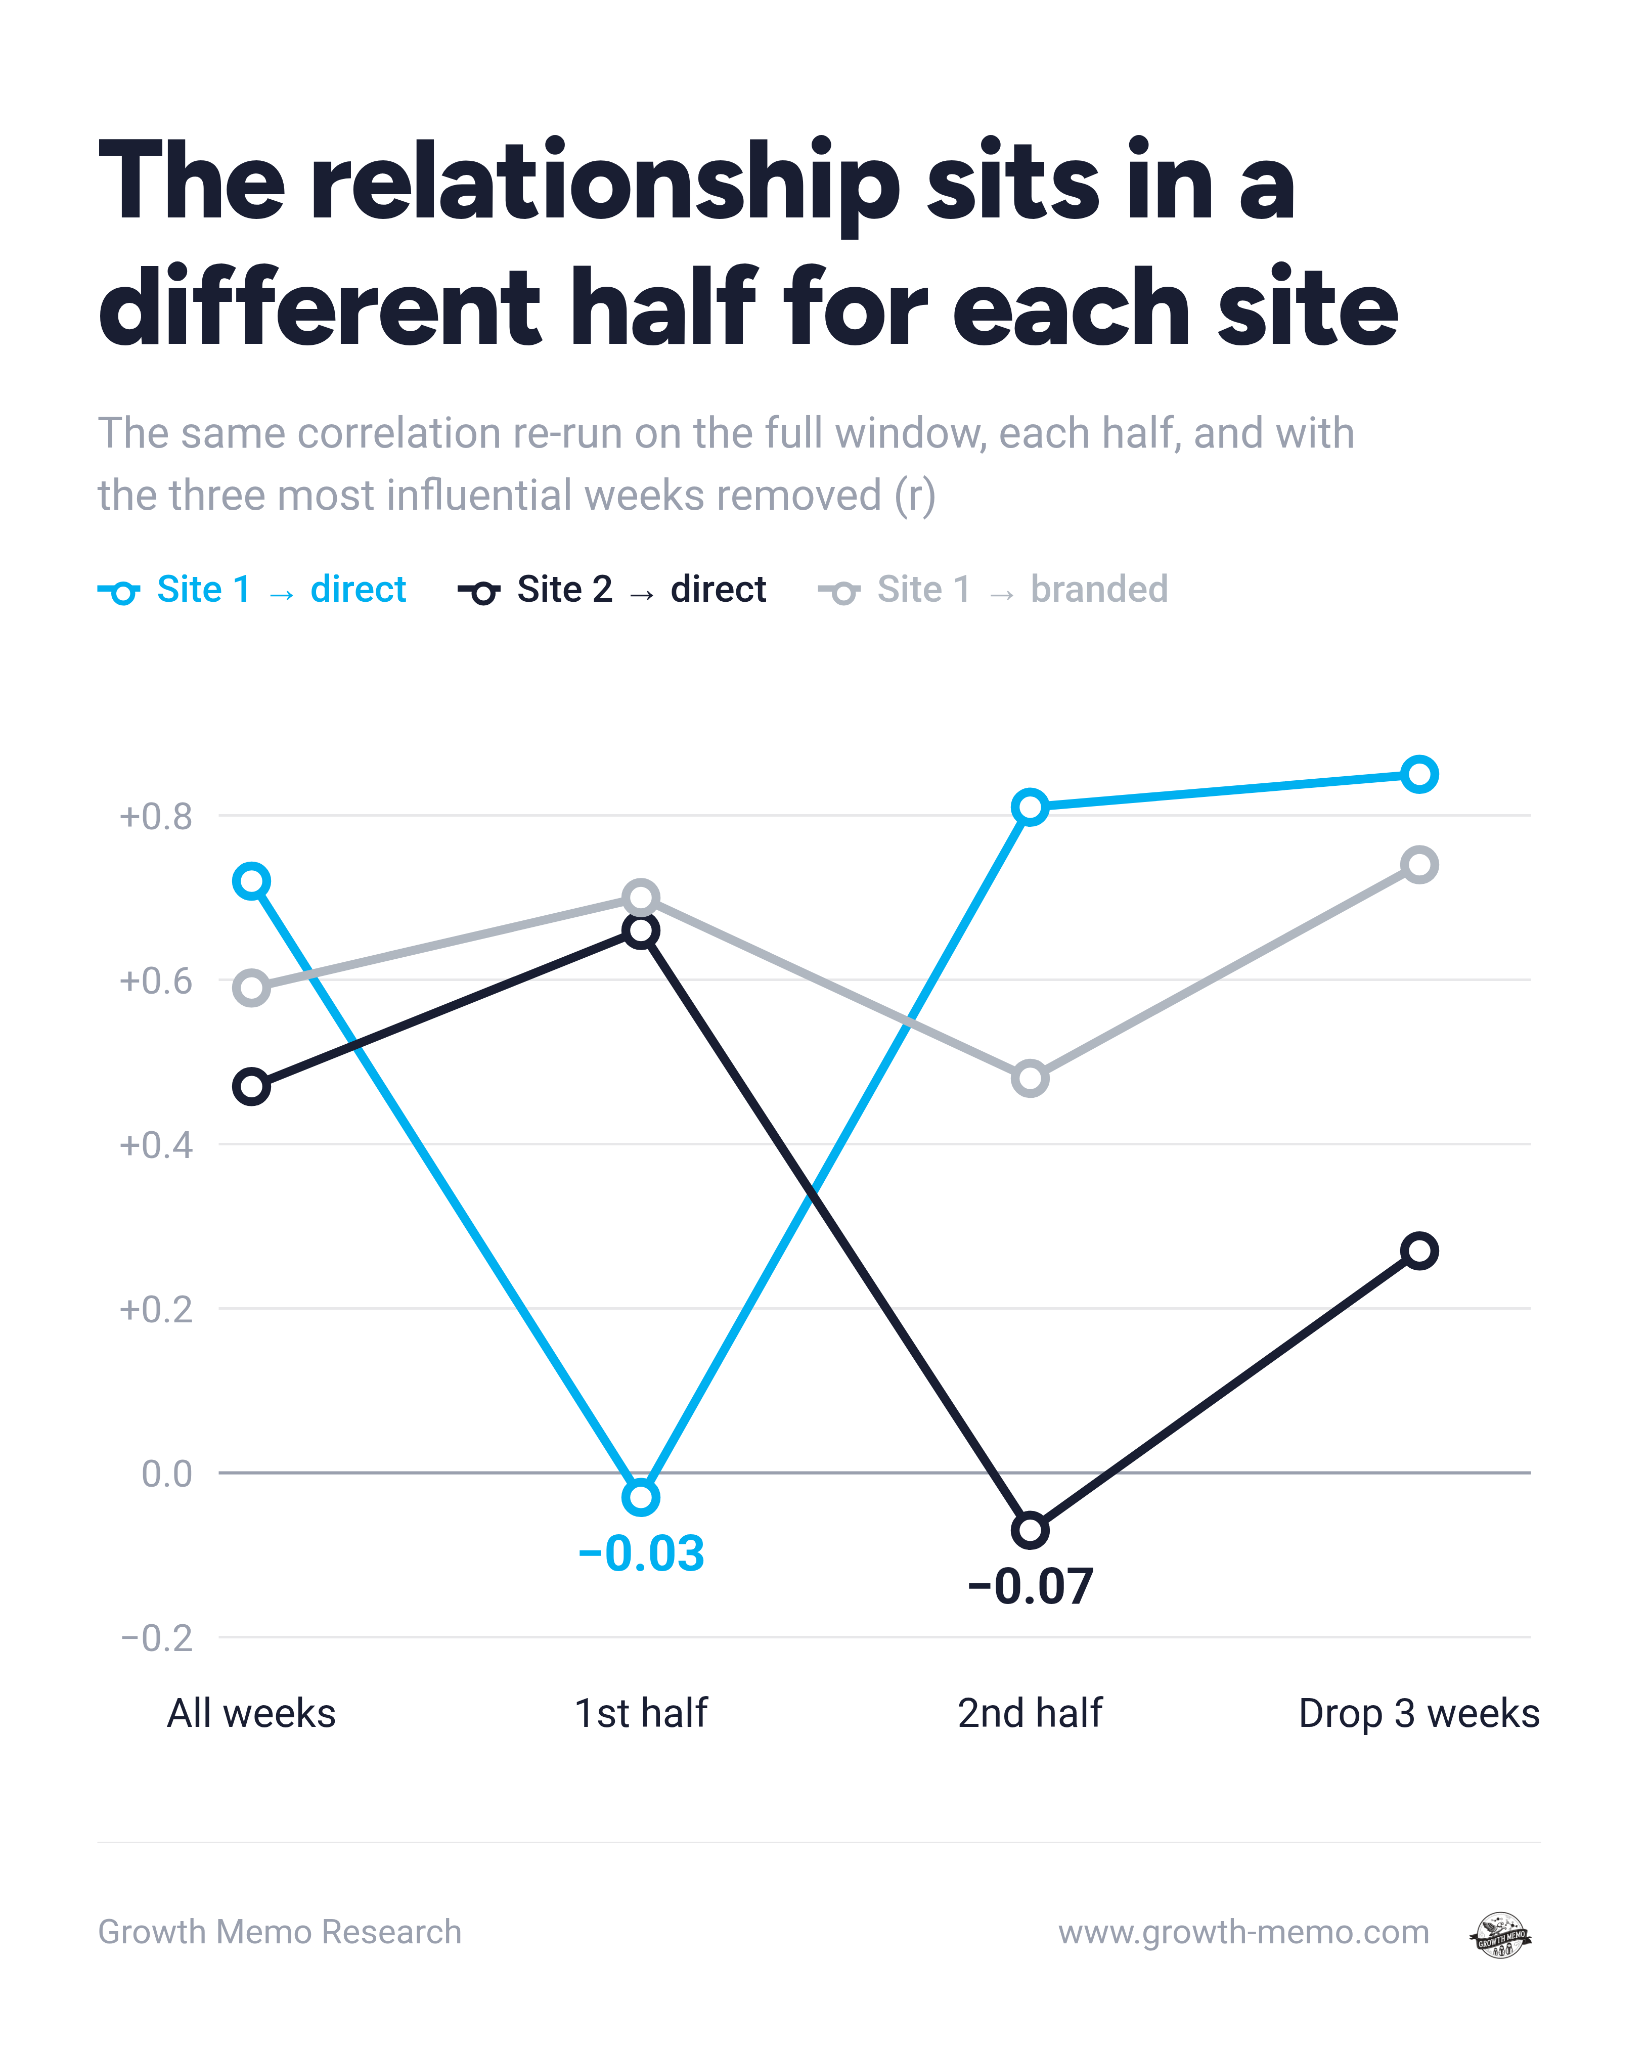
At the selected delays, these examples had only 17 and 35 usable weekly observations. That limited my ability to distinguish a modest effect from ordinary weekly variation.
The 0.72 correlation looked like the golden idol, but it set off a boulder. Across 632 tests, I compared different brands, AI metrics, and traffic measures. That creates plenty of opportunities to find something impressive. Across the four brands, I couldn’t establish a reliable link between AI visibility and subsequent branded search or Direct traffic. An effect could still exist. I just couldn’t isolate it.
Now, we can still benchmark which brands AI platforms mention and cite, and how that visibility differs by market.

This week’s sponsor, Semrush, compares seven months of US and UK data across 22 industries and four AI platforms in its latest AI Visibility Index study. It shows which brands lead in each market and why a strategy built for one country won’t necessarily carry over to another.
Use the study’s practical benchmarking plan to compare your brand’s visibility in the markets you serve.
Indiana, let it go
Clicks as underlying basis for attribution exist mainly as a result of availability bias. When marketing measurement evolved from exposure (scores and ratings) to brand lift (“half my advertising budget is wasted”) and eventually clicks, modern tools reporting clicks and using last-click attribution shaped our way of thinking. It also helped that initial CTRs and conversion rates were extremely high. But now that AI breaks the traditional click funnel (search -> click -> convert), we need to rethink.
I found that the amount of Direct traffic to longtail pages in my sample driven by AI is not detectable yet. We also can’t yet find a reliable relationship between AI Visibility and branded search or direct traffic. Some companies with outstanding AI growth might be able to detect this, but across 12 sites of different sectors and sizes, I couldn’t see it.
The better way to measure the impact of AI Visibility is a mix of self-reported attribution and triangulation of leading indicators. In The usefulness of attribution for AI Search, I argued for combining signals with different blind spots:
Where your brand appears. Track mentions and recommendations across a consistent set of relevant prompts, platforms, and markets.
How people discovered you. Ask new leads and customers where they first heard about you and what prompted them to visit. Capture their own words, including which AI tool they used and what they were researching.
What happens commercially. Connect those answers to qualified leads, purchases, and revenue. Follow the people who report AI discovery through the buying process.
As Amanda Natividad and I discussed in How to plan 2027 when traffic is down and AI won’t attribute, put exposure, customer behavior, and business outcomes on the same monthly report. If visibility rises but customers rarely mention AI, investigate whether your tracked prompts reflect how buyers actually research. If more customers report AI discovery, examine whether those customers convert and stay.
Your next leadership meeting still needs a plan, even when attribution is inconclusive. The AI Search Strategy Pitch Deck helps you structure that conversation around business priorities, experiments, and what you need to learn. Included with Growth Memo Premium.
Humbly,
Kevin